> ## Documentation Index
> Fetch the complete documentation index at: https://arivu.mintlify.site/llms.txt
> Use this file to discover all available pages before exploring further.
# Scheduled Automations
> Run queries on a recurring schedule with automated actions.
 ## Overview
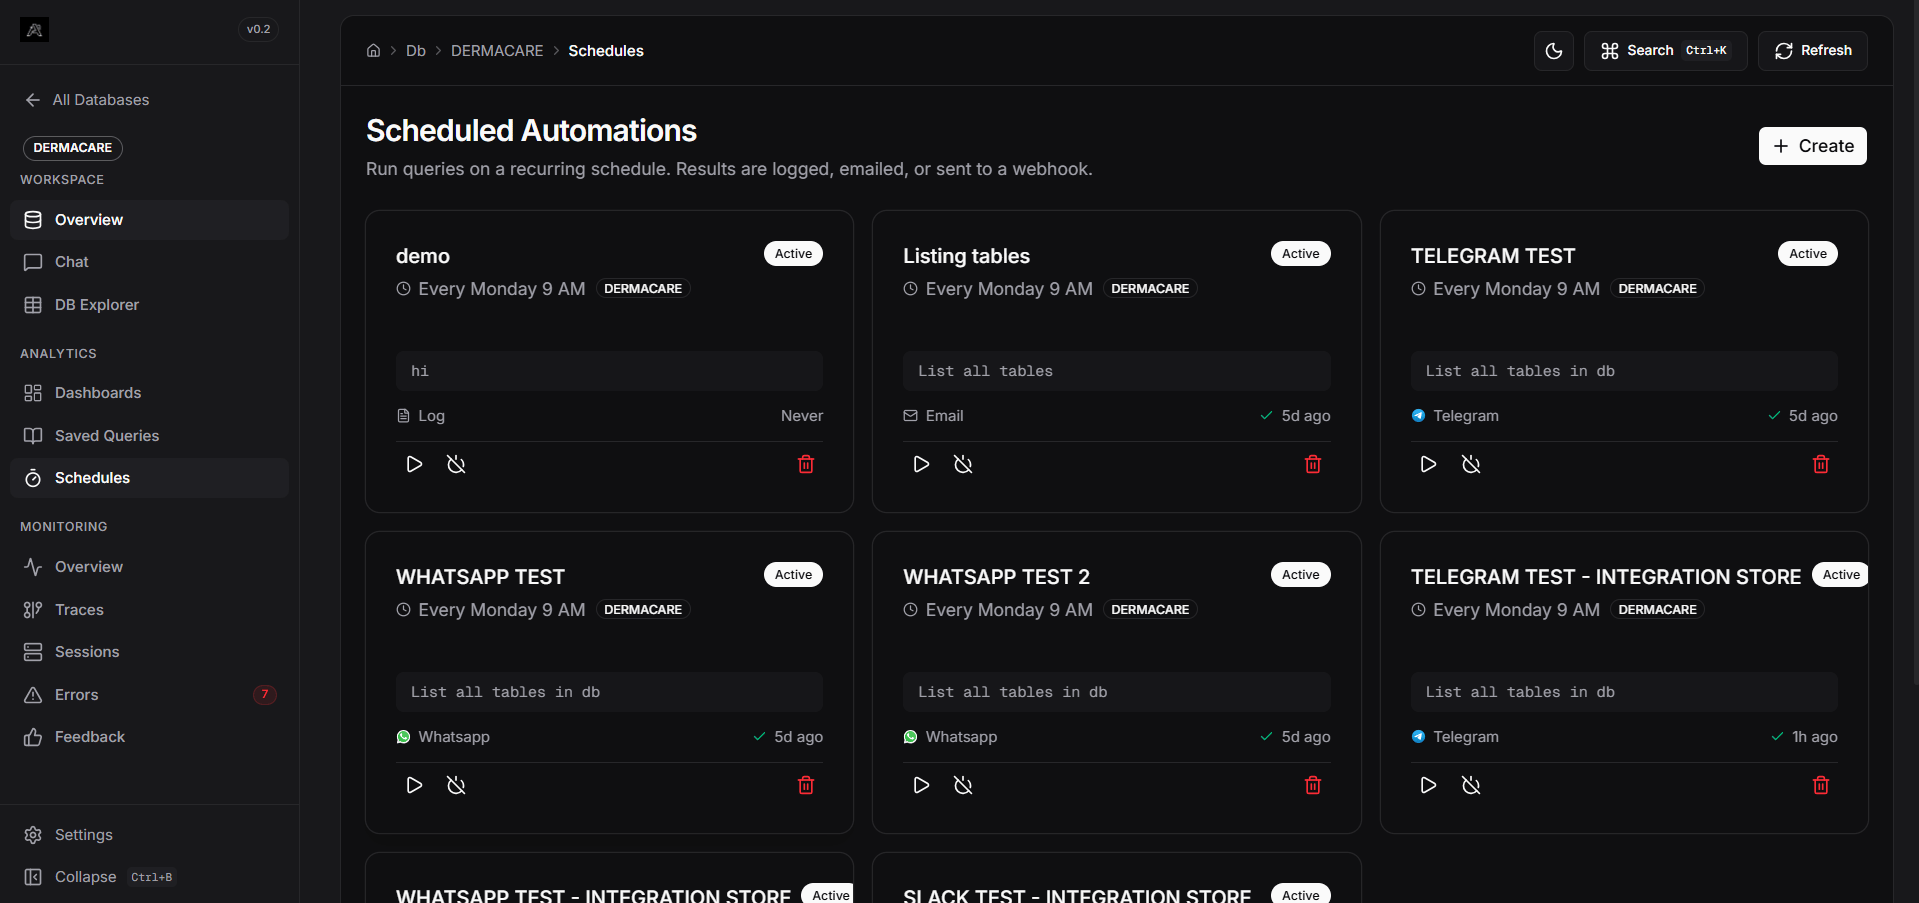
Scheduled Automations allow you to run natural language queries automatically at specified intervals, with results delivered to your configured action endpoints. Perfect for generating recurring reports, monitoring dashboards, and automated data workflows.
### Key Features
Flexible scheduling with standard cron expressions for precise timing.
Convert natural language into automated SQL execution via the pipeline.
Route results to logs, email, or webhooks automatically.
Track all automation runs with timestamps, status, and error logs.
Real-time logs and run history for each automation.
Pause automations without deleting them.
## Creating an Automation
Automations rely on Integrations to deliver reports.
If you haven't already, navigate to **Connections -> Integrations** on the global dashboard home page. Connect your desired platforms (e.g., Slack, Telegram, Webhooks). For email, ensure your SMTP settings are configured in **Settings**.
Automations are scoped to individual databases. Select a database connection from the sidebar to enter its workspace.
Inside the database workspace, click **Automations** in the sidebar, then click the **Create** button in the top right corner.
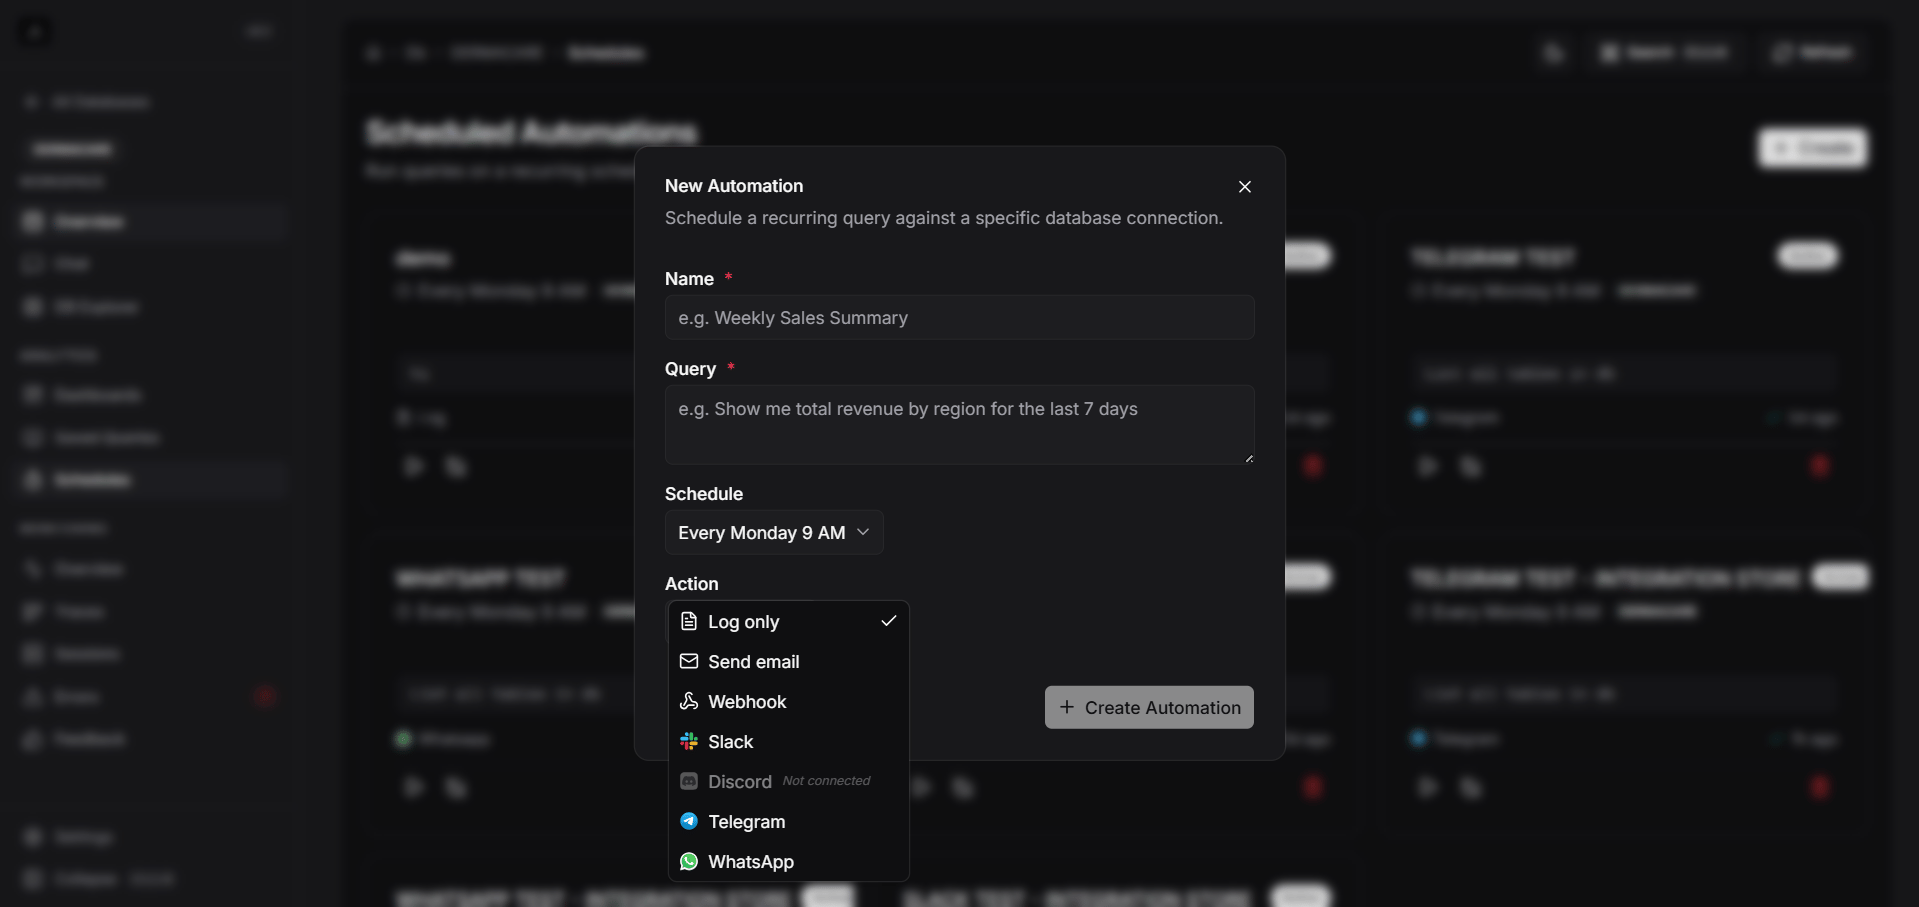
* **Name**: A descriptive name for your automation (e.g., "Daily Sales Report")
* **Query**: Natural language description of what to query (e.g., "Show me total sales by region for the last 7 days")
Select a preset schedule or enter a custom cron expression:
* **Every hour**: `0 * * * *`
* **Daily at 9 AM**: `0 9 * * *`
* **Every Monday at 9 AM**: `0 9 * * 1`
* **Custom**: Enter 5-part cron format
Select where results are delivered:
* **Log**: Stored in automation history
* **Active Integrations**: Any platform you connected in step 1 (e.g., Slack, Telegram, Webhook) will appear here. Attach it to your automation.
Click **Create** to save and activate the automation.
## Overview
Scheduled Automations allow you to run natural language queries automatically at specified intervals, with results delivered to your configured action endpoints. Perfect for generating recurring reports, monitoring dashboards, and automated data workflows.
### Key Features
Flexible scheduling with standard cron expressions for precise timing.
Convert natural language into automated SQL execution via the pipeline.
Route results to logs, email, or webhooks automatically.
Track all automation runs with timestamps, status, and error logs.
Real-time logs and run history for each automation.
Pause automations without deleting them.
## Creating an Automation
Automations rely on Integrations to deliver reports.
If you haven't already, navigate to **Connections -> Integrations** on the global dashboard home page. Connect your desired platforms (e.g., Slack, Telegram, Webhooks). For email, ensure your SMTP settings are configured in **Settings**.
Automations are scoped to individual databases. Select a database connection from the sidebar to enter its workspace.
Inside the database workspace, click **Automations** in the sidebar, then click the **Create** button in the top right corner.
* **Name**: A descriptive name for your automation (e.g., "Daily Sales Report")
* **Query**: Natural language description of what to query (e.g., "Show me total sales by region for the last 7 days")
Select a preset schedule or enter a custom cron expression:
* **Every hour**: `0 * * * *`
* **Daily at 9 AM**: `0 9 * * *`
* **Every Monday at 9 AM**: `0 9 * * 1`
* **Custom**: Enter 5-part cron format
Select where results are delivered:
* **Log**: Stored in automation history
* **Active Integrations**: Any platform you connected in step 1 (e.g., Slack, Telegram, Webhook) will appear here. Attach it to your automation.
Click **Create** to save and activate the automation.
 ## Managing Automations
### View Automation Details
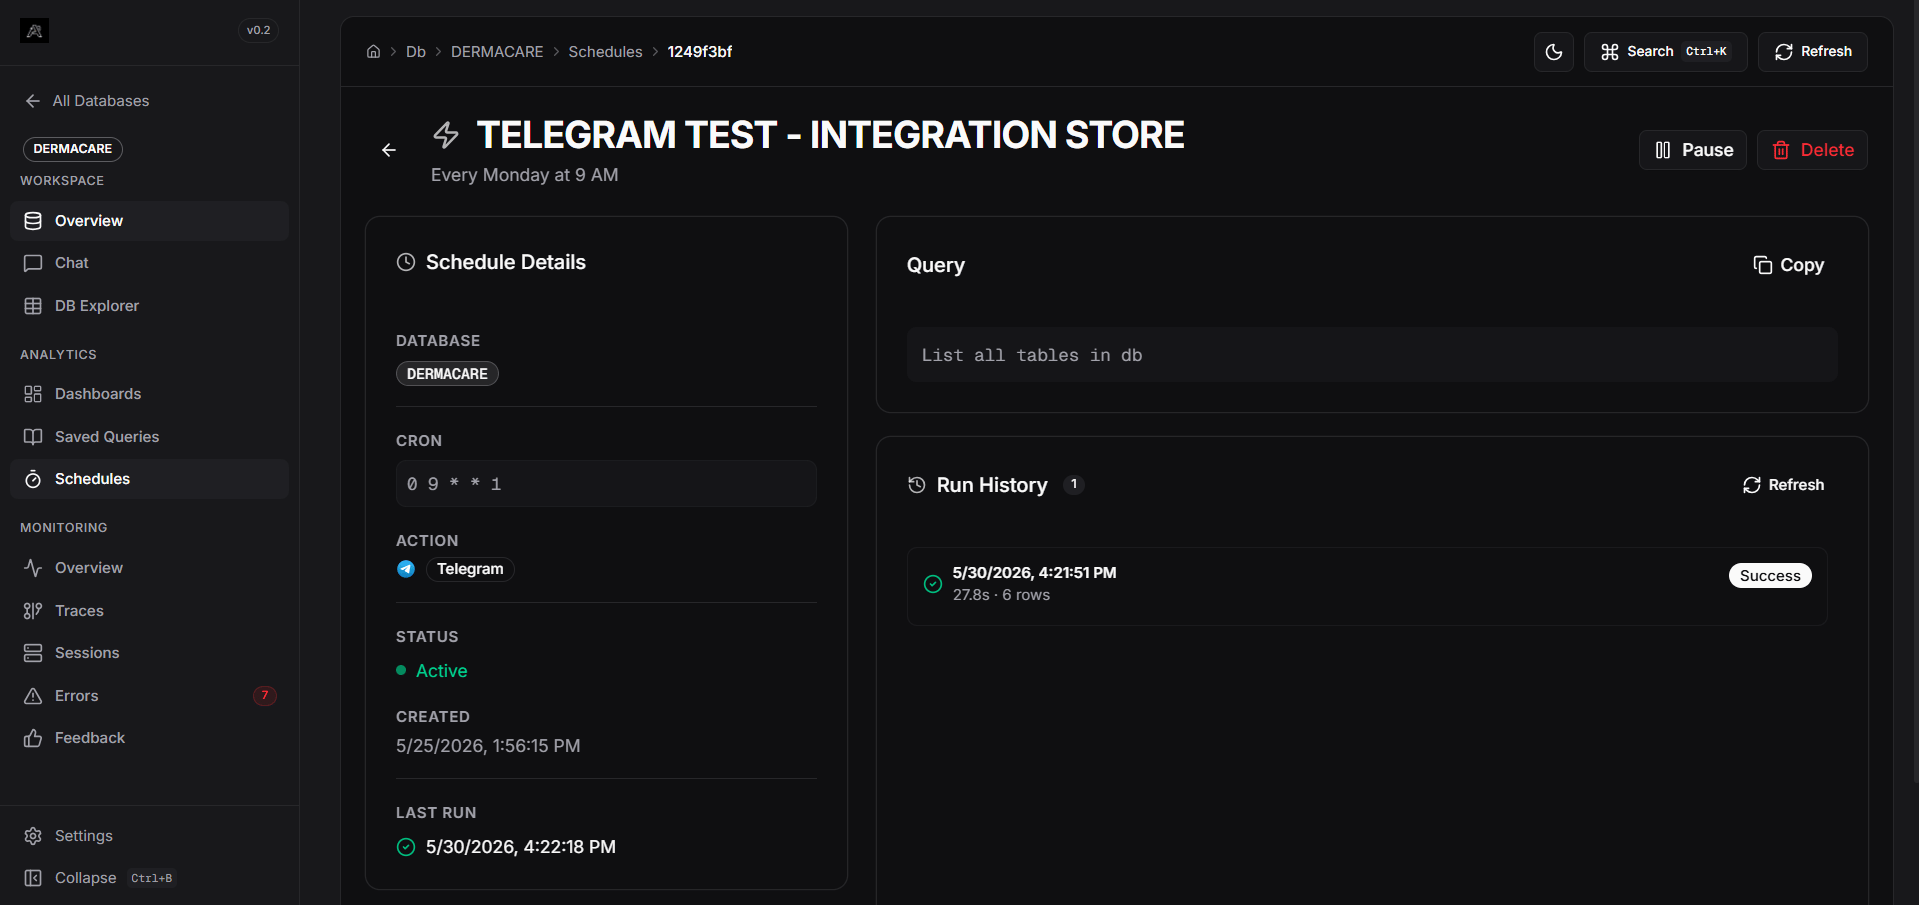
Click on any automation card to open its detail page with:
* **Schedule Details**: Cron expression, action type, status
* **Run History**: Timestamps, duration, status for each execution
* **Live Logs**: Real-time execution logs when you click "Run Now"
## Managing Automations
### View Automation Details
Click on any automation card to open its detail page with:
* **Schedule Details**: Cron expression, action type, status
* **Run History**: Timestamps, duration, status for each execution
* **Live Logs**: Real-time execution logs when you click "Run Now"
 ### Run Now
Manually trigger an automation immediately:
1. Open the automation detail page
2. Click the **Play** button (▶) at the top
3. Watch live logs stream in real-time
4. Results appear in Run History
### Pause/Resume
Toggle an automation on/off without deleting:
1. Click the **Pause** (⏸) or **Play** (▶) button on the card
2. Automation will stop running on schedule until resumed
### Edit or Delete
* **Edit**: (Coming soon) Modify automation schedule, query, or action
* **Delete**: Click the trash icon to permanently remove (no undo)
## Action Types
Results stored in automation history visible in the dashboard. Best for monitoring and analysis.
Results formatted and sent directly to your connected Telegram, WhatsApp, Slack, or Discord accounts.
Send results to a custom POST endpoint or as an HTML email to configured recipients.
## Scheduling Guide
### Common Cron Patterns
| Description | Cron Expression | Explanation |
| -------------------- | --------------- | ------------------------------ |
| Every hour | `0 * * * *` | At minute 0 of every hour |
| Every 6 hours | `0 */6 * * *` | At midnight, 6 AM, 12 PM, 6 PM |
| Daily at 9 AM | `0 9 * * *` | 09:00 every day |
| Daily at midnight | `0 0 * * *` | 00:00 every day |
| Weekly (Monday 9 AM) | `0 9 * * 1` | 09:00 every Monday |
| Weekdays 9 AM | `0 9 * * 1-5` | 09:00 Mon-Fri |
| First of month 9 AM | `0 9 1 * *` | 09:00 on the 1st |
| Every 15 minutes | `*/15 * * * *` | At :00, :15, :30, :45 |
Cron format: `minute hour day month day-of-week`. See [crontab.guru](https://crontab.guru) for an interactive editor.
## Error Handling
Automations include built-in error management:
* **Failed Query Execution**: Logged with error message, automation continues on next schedule
* **Email Delivery Failure**: Retried automatically, visible in logs
* **Webhook Timeout**: Logged and retried based on configuration
* **Data Processing Error**: Full stack trace captured in Run History
Check the **Run History** card for details on any failed executions.
## Best Practices
Use descriptive names that indicate the automation's purpose and frequency.
Use "Run Now" to test queries before setting up recurring execution.
Check Run History regularly to ensure automations are executing as expected.
Schedule resource-intensive queries during off-peak times.
Use clear, specific natural language in query descriptions for future reference.
For critical automations, export results regularly as backup.
## Limitations
* Maximum 100 concurrent automations per instance
* Queries must complete within 5 minutes
* Email actions require SMTP configuration
* Webhooks have 30-second timeout
* Run history retained for 90 days
## Troubleshooting
### Automation Not Running
Ensure the automation shows the green "Active" badge.
Confirm the cron expression matches your intended frequency.
Verify the active connection is still valid in your session.
Open the automation detail page and check Run History for error messages.
### Query Execution Failed
Use "Run Now" to see the exact error in live logs.
If the natural language query is ambiguous, be more specific.
Ensure required tables and columns exist in your database.
### Email Not Received
Go to Settings → Email Configuration and test your SMTP settings.
Look for "Email delivery failed" messages in Run History.
Confirm the email address is correctly configured.
***
## Next Steps
* [Explore Dashboard Integration](/dashboard/dashboards/overview)
* [Set Up Email Configuration](/dashboard/settings)
* [Monitor Execution with Traces](/dashboard/monitoring/traces)
### Run Now
Manually trigger an automation immediately:
1. Open the automation detail page
2. Click the **Play** button (▶) at the top
3. Watch live logs stream in real-time
4. Results appear in Run History
### Pause/Resume
Toggle an automation on/off without deleting:
1. Click the **Pause** (⏸) or **Play** (▶) button on the card
2. Automation will stop running on schedule until resumed
### Edit or Delete
* **Edit**: (Coming soon) Modify automation schedule, query, or action
* **Delete**: Click the trash icon to permanently remove (no undo)
## Action Types
Results stored in automation history visible in the dashboard. Best for monitoring and analysis.
Results formatted and sent directly to your connected Telegram, WhatsApp, Slack, or Discord accounts.
Send results to a custom POST endpoint or as an HTML email to configured recipients.
## Scheduling Guide
### Common Cron Patterns
| Description | Cron Expression | Explanation |
| -------------------- | --------------- | ------------------------------ |
| Every hour | `0 * * * *` | At minute 0 of every hour |
| Every 6 hours | `0 */6 * * *` | At midnight, 6 AM, 12 PM, 6 PM |
| Daily at 9 AM | `0 9 * * *` | 09:00 every day |
| Daily at midnight | `0 0 * * *` | 00:00 every day |
| Weekly (Monday 9 AM) | `0 9 * * 1` | 09:00 every Monday |
| Weekdays 9 AM | `0 9 * * 1-5` | 09:00 Mon-Fri |
| First of month 9 AM | `0 9 1 * *` | 09:00 on the 1st |
| Every 15 minutes | `*/15 * * * *` | At :00, :15, :30, :45 |
Cron format: `minute hour day month day-of-week`. See [crontab.guru](https://crontab.guru) for an interactive editor.
## Error Handling
Automations include built-in error management:
* **Failed Query Execution**: Logged with error message, automation continues on next schedule
* **Email Delivery Failure**: Retried automatically, visible in logs
* **Webhook Timeout**: Logged and retried based on configuration
* **Data Processing Error**: Full stack trace captured in Run History
Check the **Run History** card for details on any failed executions.
## Best Practices
Use descriptive names that indicate the automation's purpose and frequency.
Use "Run Now" to test queries before setting up recurring execution.
Check Run History regularly to ensure automations are executing as expected.
Schedule resource-intensive queries during off-peak times.
Use clear, specific natural language in query descriptions for future reference.
For critical automations, export results regularly as backup.
## Limitations
* Maximum 100 concurrent automations per instance
* Queries must complete within 5 minutes
* Email actions require SMTP configuration
* Webhooks have 30-second timeout
* Run history retained for 90 days
## Troubleshooting
### Automation Not Running
Ensure the automation shows the green "Active" badge.
Confirm the cron expression matches your intended frequency.
Verify the active connection is still valid in your session.
Open the automation detail page and check Run History for error messages.
### Query Execution Failed
Use "Run Now" to see the exact error in live logs.
If the natural language query is ambiguous, be more specific.
Ensure required tables and columns exist in your database.
### Email Not Received
Go to Settings → Email Configuration and test your SMTP settings.
Look for "Email delivery failed" messages in Run History.
Confirm the email address is correctly configured.
***
## Next Steps
* [Explore Dashboard Integration](/dashboard/dashboards/overview)
* [Set Up Email Configuration](/dashboard/settings)
* [Monitor Execution with Traces](/dashboard/monitoring/traces)