> ## Documentation Index
> Fetch the complete documentation index at: https://arivu.mintlify.site/llms.txt
> Use this file to discover all available pages before exploring further.
# Dashboard Overview
> Build and customize powerful analytical dashboards.
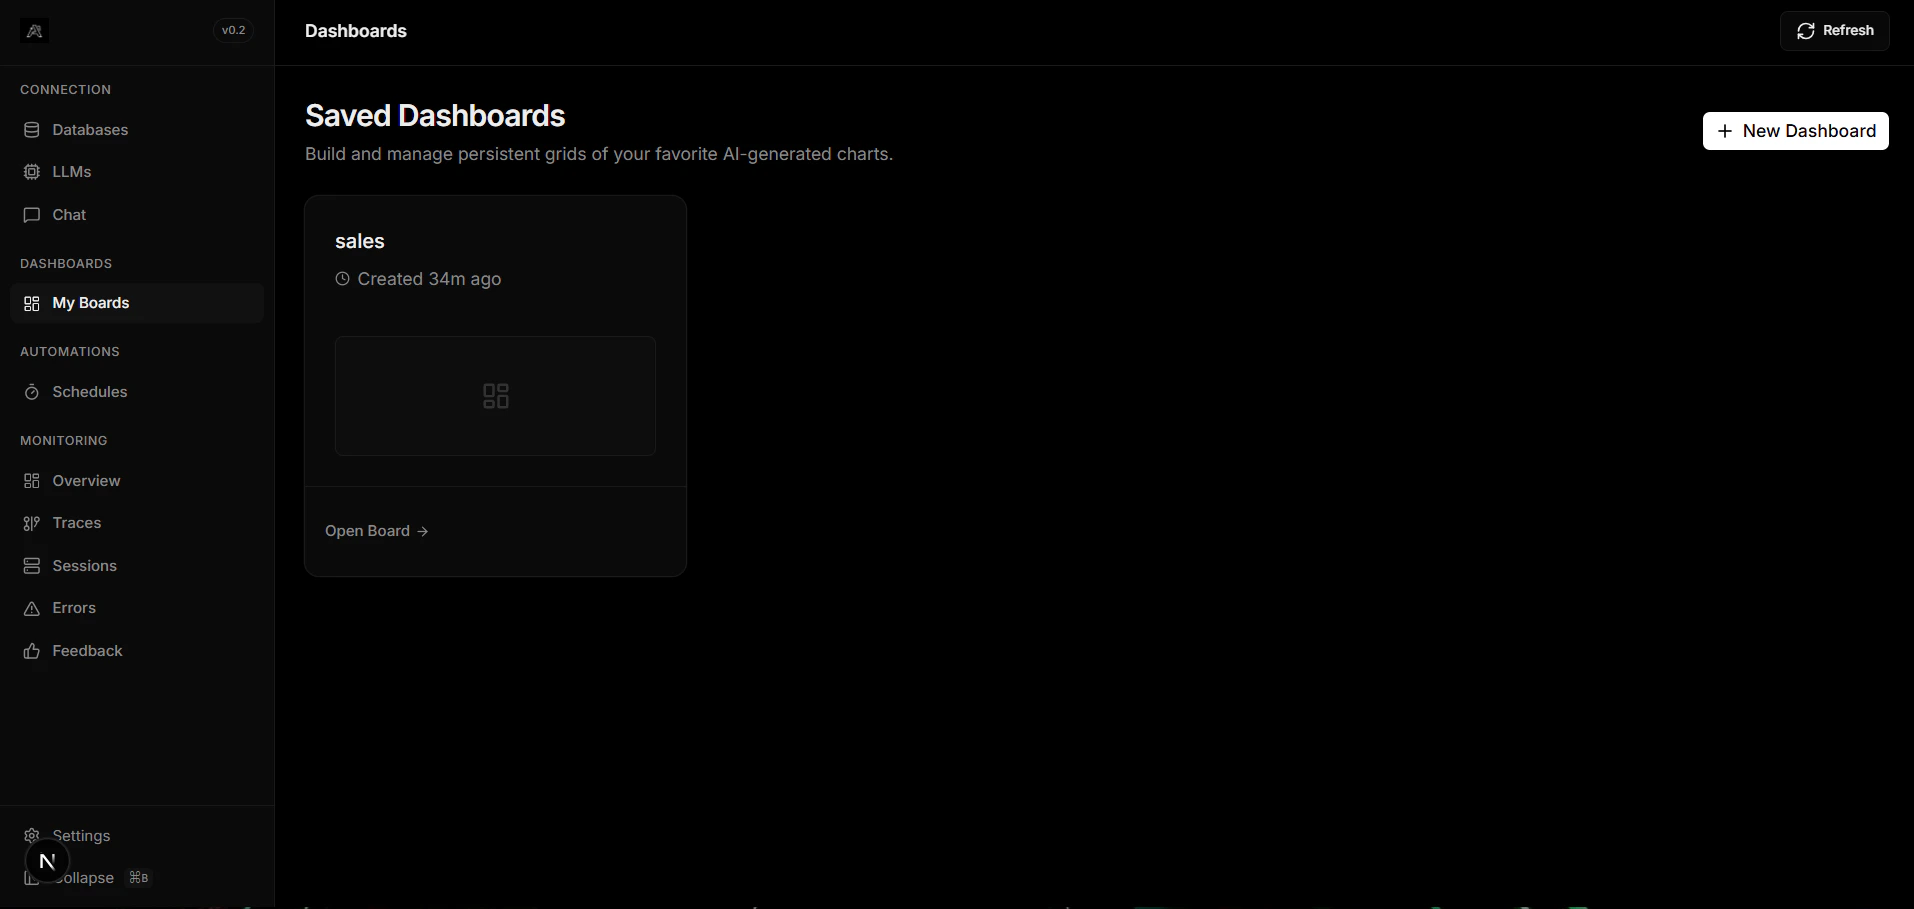 ## What is a Dashboard?
Dashboards in Arivu are customizable visual interfaces that aggregate charts and metrics. Because Arivu operates on a **Workspace** model, dashboards are scoped to a specific database alias, allowing you to build tailored views for each data source.
In Arivu, creating a dashboard is the first step. Once a dashboard is created, you populate it with charts.
Dashboards belong to specific database workspaces, keeping metrics isolated and secure.
Drag, drop, and resize charts neatly on a grid to match your workflow.
## The Workflow
To build your visual analytics, follow this simple two-step process:
Navigate to the Dashboards section inside your database workspace and click **Create Dashboard**. Give it a descriptive name.
Once your dashboard is created, you can add charts to it using one of two methods:
1. **Manual Creation**: Build a chart by selecting tables and mapping axes directly.
2. **Chat Interface**: Ask a question in chat and pin the resulting Generative UI chart to your dashboard.
Pro tip: You can rearrange and resize charts at any time by dragging them around on the dashboard canvas. The layout saves automatically.
## Next Steps
Learn how to populate your dashboards using our supported methods:
Create per-table charts manually by configuring columns, X, and Y axes.
Pin AI-generated charts directly from the Chat interface.
## What is a Dashboard?
Dashboards in Arivu are customizable visual interfaces that aggregate charts and metrics. Because Arivu operates on a **Workspace** model, dashboards are scoped to a specific database alias, allowing you to build tailored views for each data source.
In Arivu, creating a dashboard is the first step. Once a dashboard is created, you populate it with charts.
Dashboards belong to specific database workspaces, keeping metrics isolated and secure.
Drag, drop, and resize charts neatly on a grid to match your workflow.
## The Workflow
To build your visual analytics, follow this simple two-step process:
Navigate to the Dashboards section inside your database workspace and click **Create Dashboard**. Give it a descriptive name.
Once your dashboard is created, you can add charts to it using one of two methods:
1. **Manual Creation**: Build a chart by selecting tables and mapping axes directly.
2. **Chat Interface**: Ask a question in chat and pin the resulting Generative UI chart to your dashboard.
Pro tip: You can rearrange and resize charts at any time by dragging them around on the dashboard canvas. The layout saves automatically.
## Next Steps
Learn how to populate your dashboards using our supported methods:
Create per-table charts manually by configuring columns, X, and Y axes.
Pin AI-generated charts directly from the Chat interface.