> ## Documentation Index
> Fetch the complete documentation index at: https://arivu.mintlify.site/llms.txt
> Use this file to discover all available pages before exploring further.
# Pipeline Traces
> Granular latency and logic execution tracking.
 ## Overview
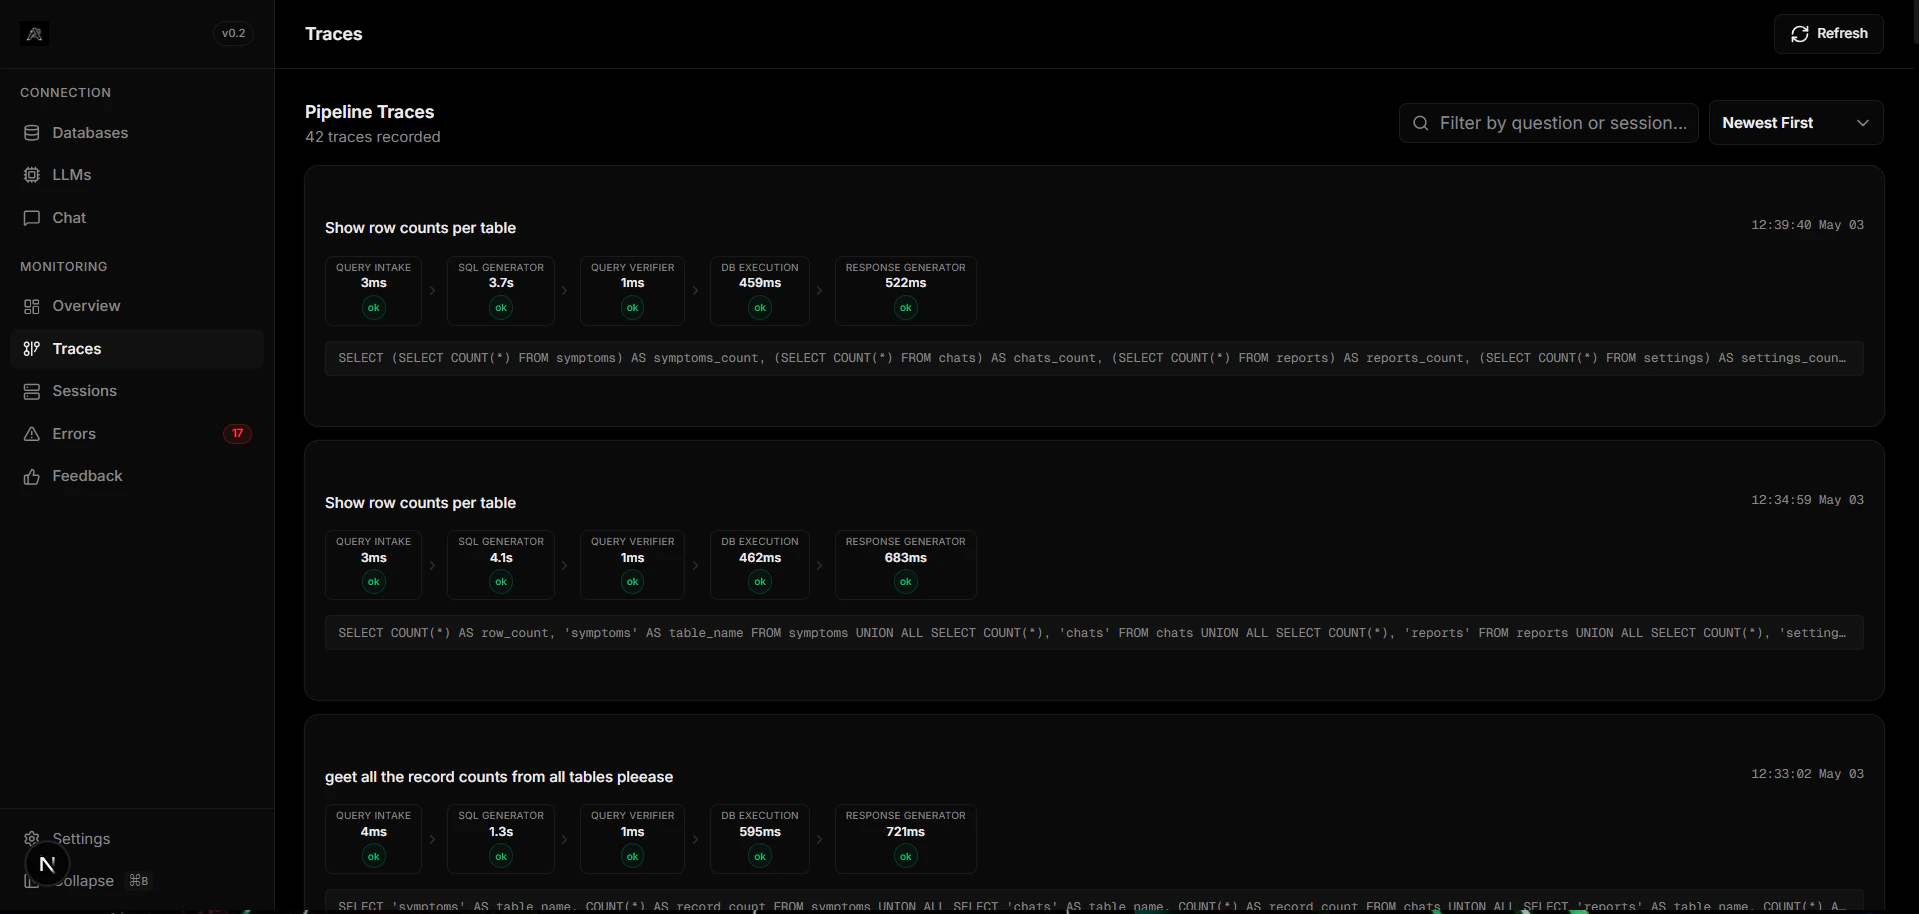
Arivu operates via a complex LangGraph state machine. The Traces dashboard provides a visual map of exactly how much time each node took and the transformations applied to the data payload locally.
Identify latency bottlenecks down to the exact pipeline boundary.
Monitor how the state dictionary morphs through generation and verification.
## What You Can Inspect
Visualize self-correction loops. When the `query_verifier` rejects SQL, the trace shows the round-trip back to `sql_generator` with the error context injected.
LLM token usage tracking per node. See exactly how many input/output tokens were consumed and calculate cost-per-query.
A per-node millisecond breakdown: intake, generation, verification, execution, and response. Quickly spot if the LLM or the database is the bottleneck.
Pipeline trace data persists inside your local `arivu.db` (SQLite) or a Redis cluster if configured. Your telemetry never leaves your infrastructure.
## Overview
Arivu operates via a complex LangGraph state machine. The Traces dashboard provides a visual map of exactly how much time each node took and the transformations applied to the data payload locally.
Identify latency bottlenecks down to the exact pipeline boundary.
Monitor how the state dictionary morphs through generation and verification.
## What You Can Inspect
Visualize self-correction loops. When the `query_verifier` rejects SQL, the trace shows the round-trip back to `sql_generator` with the error context injected.
LLM token usage tracking per node. See exactly how many input/output tokens were consumed and calculate cost-per-query.
A per-node millisecond breakdown: intake, generation, verification, execution, and response. Quickly spot if the LLM or the database is the bottleneck.
Pipeline trace data persists inside your local `arivu.db` (SQLite) or a Redis cluster if configured. Your telemetry never leaves your infrastructure.