> ## Documentation Index
> Fetch the complete documentation index at: https://arivu.mintlify.site/llms.txt
> Use this file to discover all available pages before exploring further.
# Dashboard Overview
> A high-level overview of the Arivu Dashboard
 ## Welcome to the Dashboard
The Arivu Dashboard is the primary interface for interacting with your AI agent. It is built using Next.js and Tailwind CSS, featuring a beautiful, highly responsive interface that automatically adapts to your system theme.
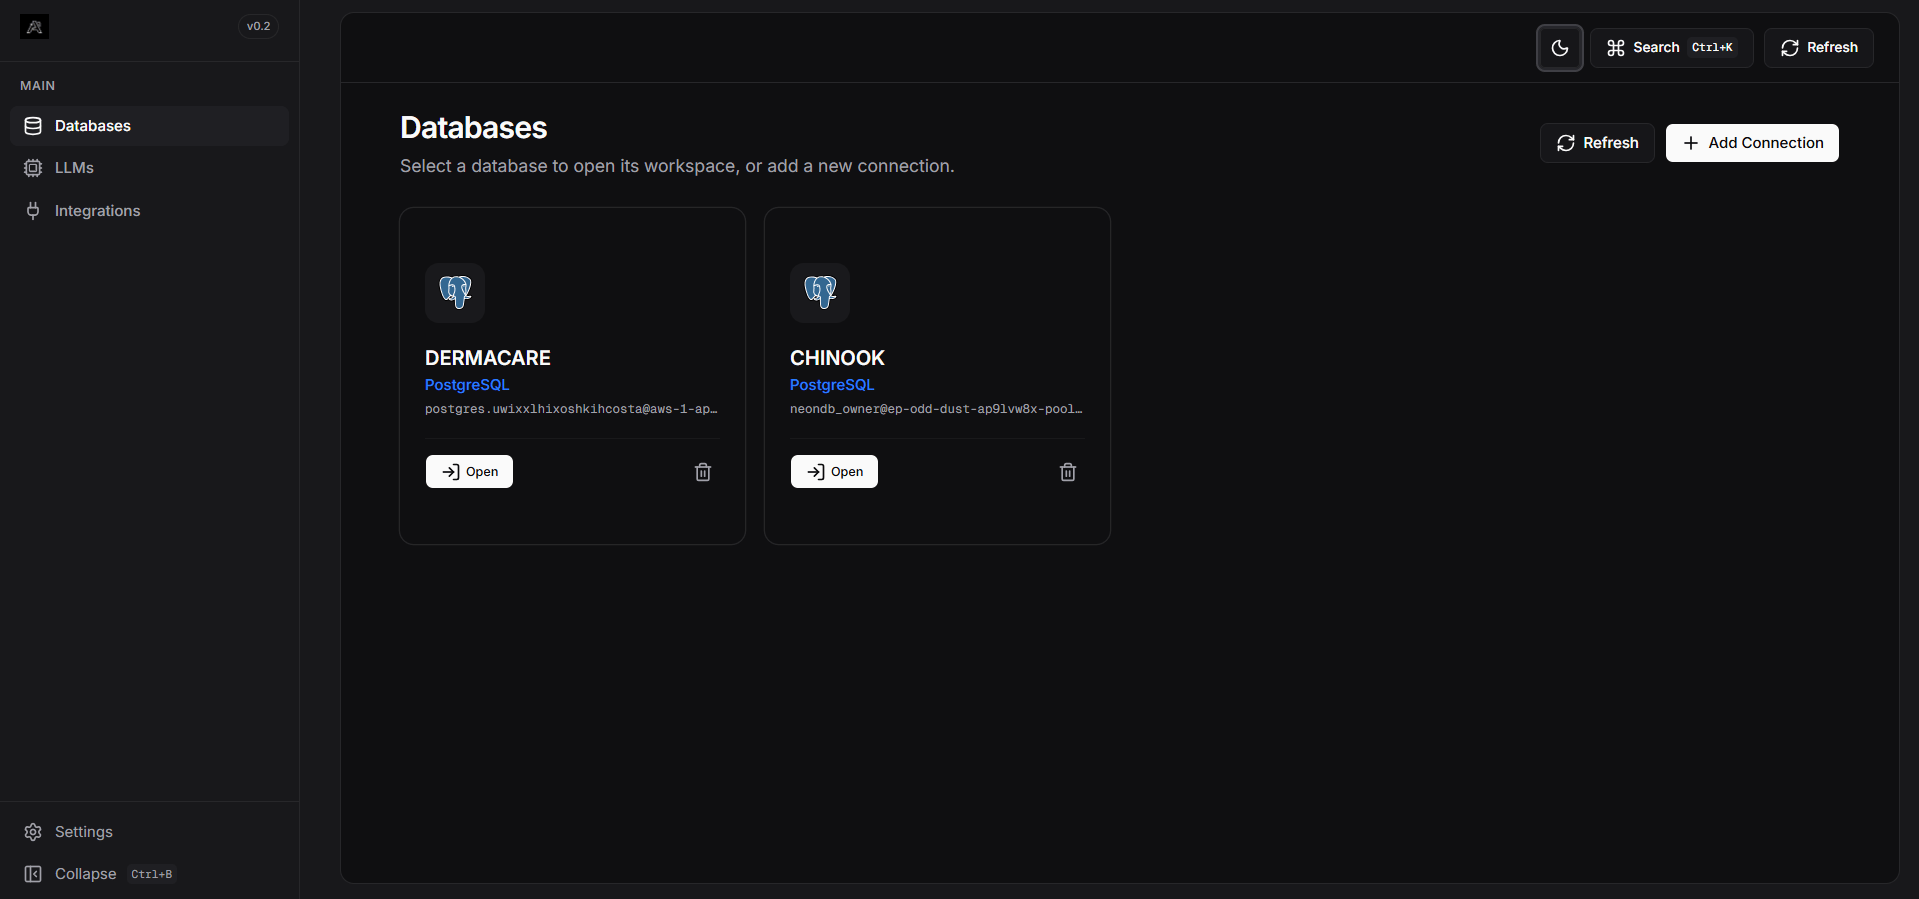
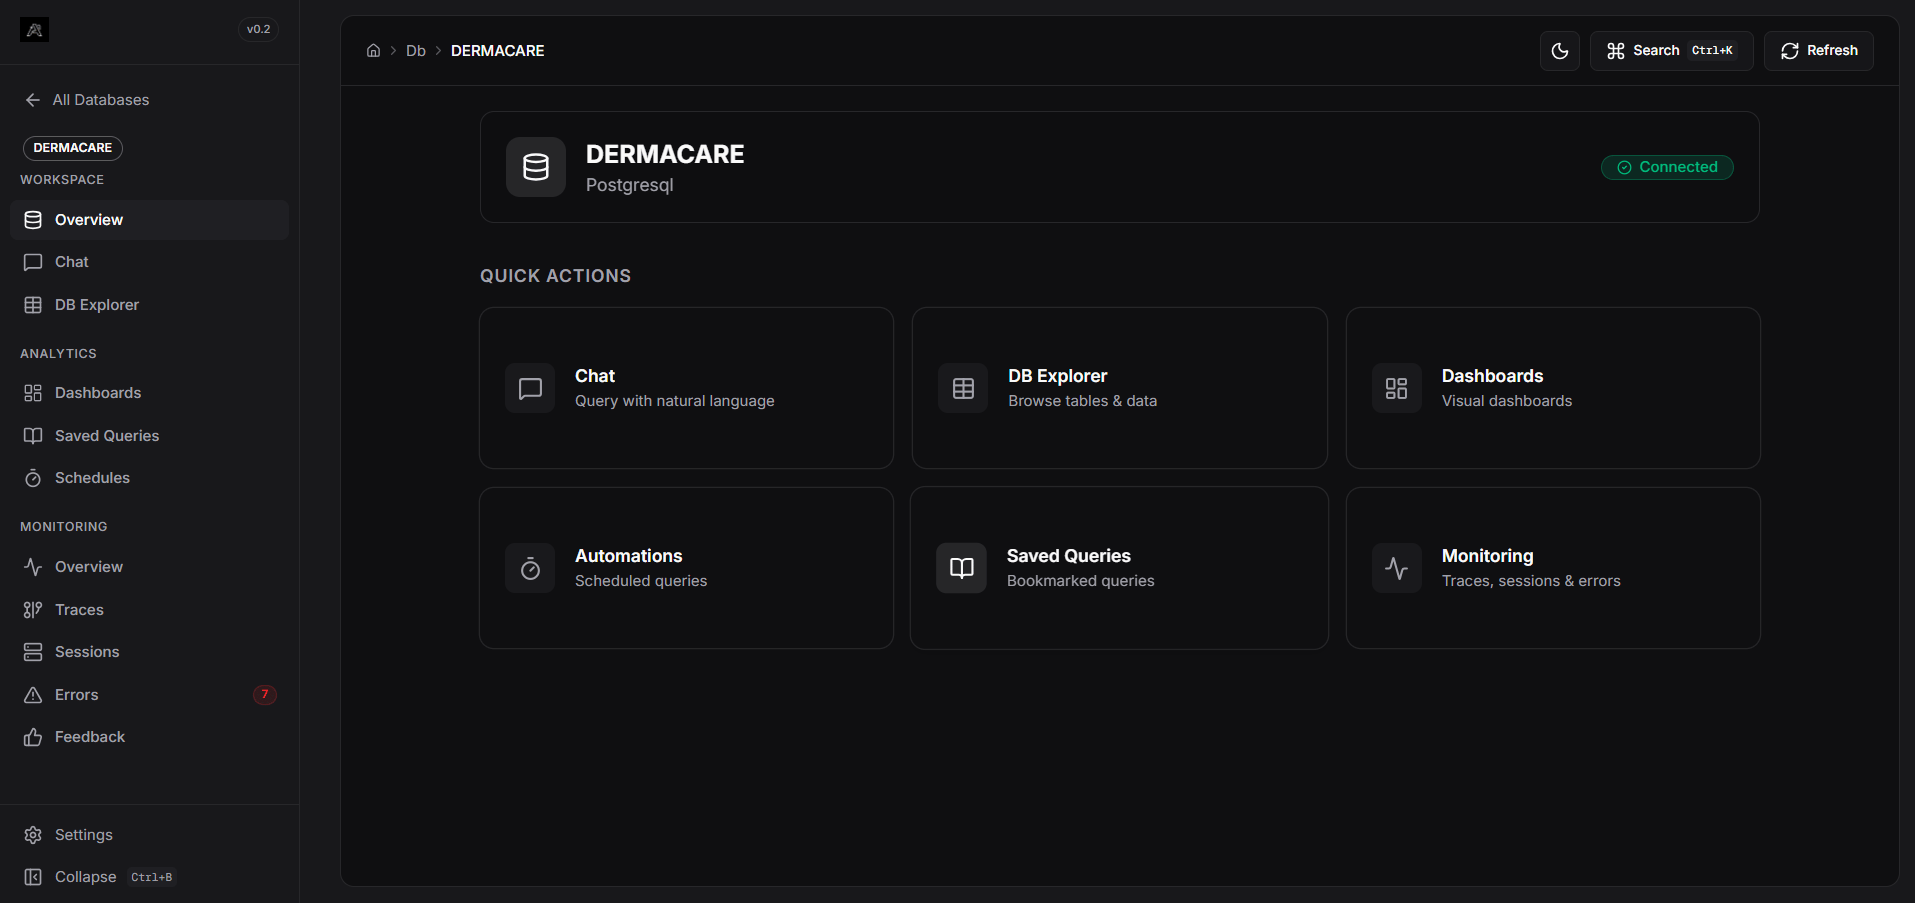
The dashboard uses a **Workspace (DB Tenant)** model. Instead of a single global environment, features like Chat, Dashboards, and Automations are scoped to a specific Database alias, allowing you to seamlessly switch contexts across multiple connections.
Before asking questions, you need to connect your database. Head over to the Connections module to securely link PostgreSQL, MySQL, SQLite, and more.
Navigate into a specific database alias from the sidebar. All subsequent actions (Chat, Automations, Dashboards) operate within this isolated tenant.
Use the chat interface to ask natural language questions. The LangGraph agent will automatically write the SQL, execute it, and return the data which you can visualize and pin to custom dashboards.
## Welcome to the Dashboard
The Arivu Dashboard is the primary interface for interacting with your AI agent. It is built using Next.js and Tailwind CSS, featuring a beautiful, highly responsive interface that automatically adapts to your system theme.
The dashboard uses a **Workspace (DB Tenant)** model. Instead of a single global environment, features like Chat, Dashboards, and Automations are scoped to a specific Database alias, allowing you to seamlessly switch contexts across multiple connections.
Before asking questions, you need to connect your database. Head over to the Connections module to securely link PostgreSQL, MySQL, SQLite, and more.
Navigate into a specific database alias from the sidebar. All subsequent actions (Chat, Automations, Dashboards) operate within this isolated tenant.
Use the chat interface to ask natural language questions. The LangGraph agent will automatically write the SQL, execute it, and return the data which you can visualize and pin to custom dashboards.
 ## Key Sections
Add, remove, and manage your database credentials, LLM models, and app integrations.
The main workspace for natural language analytics within a specific database.
Create interactive charts manually or pin them directly from chat results.
Inspect node-level execution latency and state diffs.
## Key Sections
Add, remove, and manage your database credentials, LLM models, and app integrations.
The main workspace for natural language analytics within a specific database.
Create interactive charts manually or pin them directly from chat results.
Inspect node-level execution latency and state diffs.