Documentation Index
Fetch the complete documentation index at: https://arivu.mintlify.app/llms.txt
Use this file to discover all available pages before exploring further.
Integration Overview (supported)
Arivu dashboards currently support a focused set of integrations relevant to the current implementation. To avoid describing unimplemented or experimental features, this page documents only what is available and maintained:- Display automation results as charts (pin automation output to dashboards)
- Create and manage charts from saved queries and automation results
- Pin charts to dashboards and edit dashboard layouts
Automations
Pin automation results (chart or table) to dashboards for monitoring.
Charts
Create charts from queries and automation outputs, configure axes and labels.
Automation Integration (supported flow)
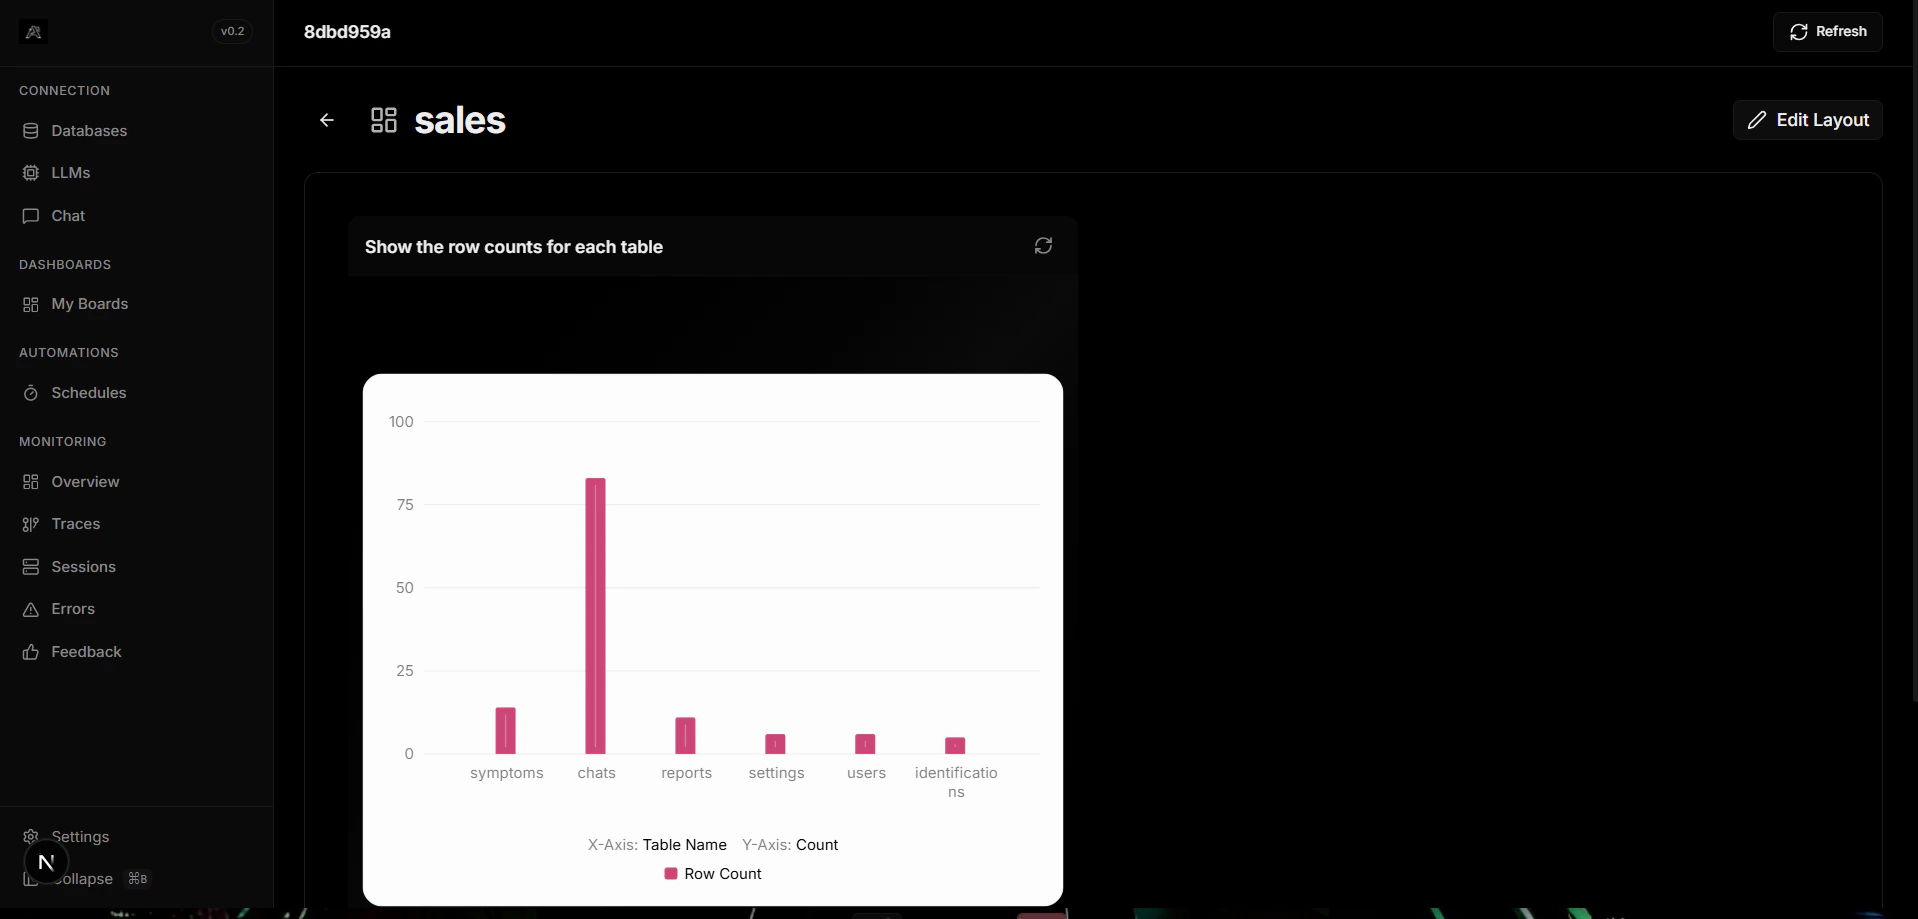
Display Automation Results
Pin automation outputs to dashboards to monitor scheduled execution and results:- Open the automation detail page
- Click the “Pin” button
- Select the target dashboard
- The automation’s result appears as a chart on that dashboard
Automation Status
Monitor basic automation health on dashboards:- Enabled/Disabled status
- Last Run timestamp
- Run History link to detailed logs
Chart Integration
Create Chart from a Query
Save a query and choose a chart type (line, bar, pie). Configure axes and labels and save the chart.Pin Chart to Dashboard
From the chart view, click Pin and choose the dashboard. Rearrange the chart on the dashboard layout editor.Constraints
- This page intentionally avoids describing unimplemented features such as embedded chat widgets, cross-database join widgets, or advanced streaming widgets.
- For advanced visualization requirements, propose them and we’ll plan them into the roadmap.