

Pinning a Chart from Chat
1
Ask a Question
Navigate to the Chat interface in your database workspace. Ask a question that yields tabular data (e.g., “Show me daily signups over the last month” or “What is the revenue breakdown by product category?”).
2
View the Response Card
Arivu will generate the SQL, execute it, and return a response card. If the data is suitable, a visualization will automatically render.
3
Click Pin
On the visualized chart card in the chat, locate and click the Pin icon.
4
Select Destination Dashboard
A modal will appear prompting you to select an existing dashboard. Choose the dashboard you want this chart to live on.
5
Customize Layout
Navigate back to that Dashboard. You will see the generated chart has been added. You can now resize and drag it to customize the layout neatly alongside your other metrics.
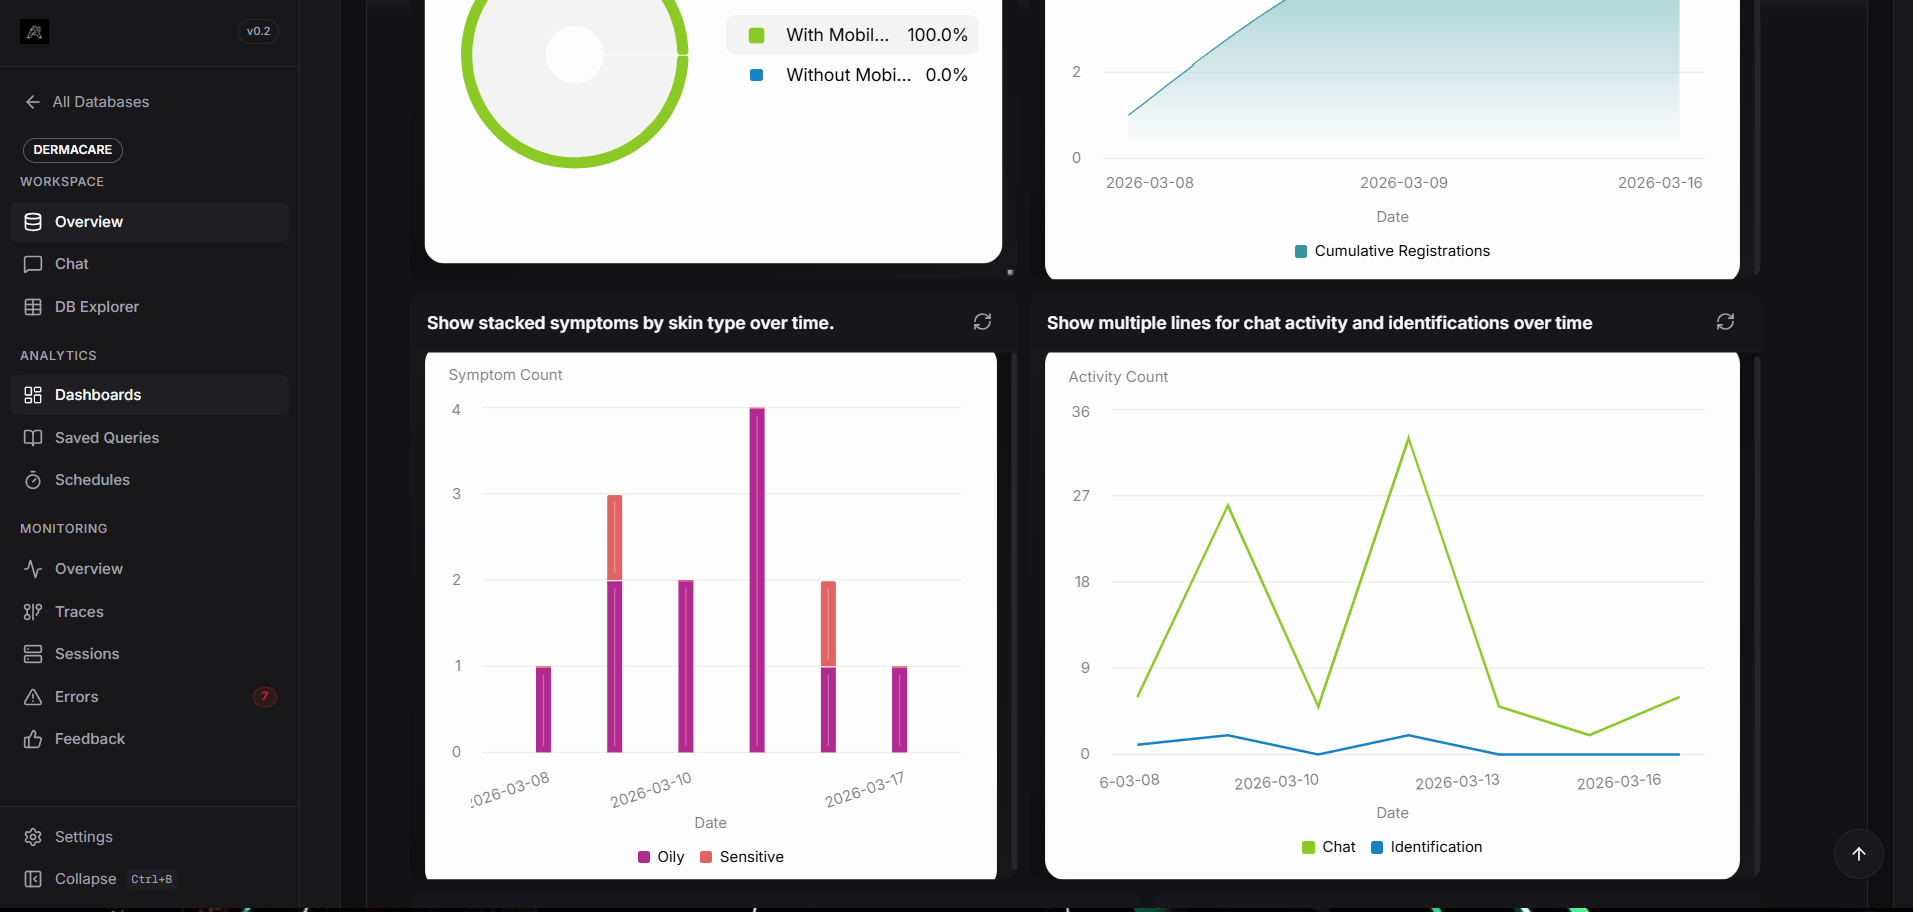
When you pin a chart from the chat, the underlying SQL generated by the LLM is saved with the chart widget. Every time the dashboard refreshes, it will re-execute that exact SQL to fetch live data.